


Table of Contents
Introduction to Google Analytics
Google-Analytics are web service tools, powered by Google. Google launched the Google Analytics platform in November 2005. Google Analytics helps you track traffic to your website. This tool is a useful tool for every webmaster. By using Google Analytics, you will be able to do an in-depth analysis of the visitors to your website. Using Google Analytics, you will be able to understand what you should work on. It takes you in the right direction.
It helps to understand which page your visitors are most engaged in, on which page you are getting the highest bounce rate, and most importantly, how do you retain users?
In this article, you will learn about
1. The Importance of Google Analytics for Your Business
2. How to set up a Google Analytics account; Step by Step
3. How to navigate through the Google Analytics interface
4. What are the key metrics you should notice
5. How to use Google Analytics data to drive more traffic to your website
1. Importance of Google Analytics for your business
Google Analytics helps you understand which sources your site is getting traffic from. Analytics helps you check for real-time traffic and which page your visitor stays on.
Google Analytics helps you understand your audience’s age, gender, interest, device, and location, and the social platform you’re getting the most traffic from.
Google Analytics helps to Understand:-
- How do you get users?
- What are your active users going over time?
- How well do you retain users?
- When do your users arrive?
- Where are your users
- What are your top devices?
- Which pages do your users visit?
Google Analytics shows your top pages in terms of page views. You can also improve the performance of your website by using Google Analytics. You can set a goal to achieve your goal with Google Analytics. And you can get weekly and monthly traffic Reports from Analytics. By focusing on these, you will be able to take the right steps in the right direction to grow your business.
2. How to set up Google Analytics Account; step by step
Step 1. simply type <Google Analytics> into Google.
Step 2. Sign in with your Google account (if you do not have a Google account, just click <Create Account> and create a new one.
Step 3. When you are signed in with your Google account, just click on Access Google Analytics.
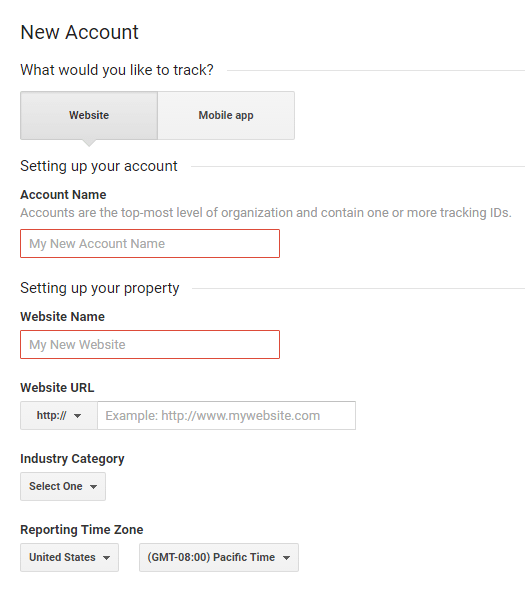
Step 4. Fill in the correct information in the blank- Select the account name, website name, website URL, and industry category, and reporting time zone.
Fill in the details as shown in the picture below.
Step 5. When you have completed the form, click the <Gate Tracking ID> button that appears at the bottom of the page. And by clicking on the checkbox, agree to the Google Analytics Terms of Service.
Step 6. Add Tracking ID to your website If you are using WordPress then just paste the Analytics tracking code into your script.
paste this code on your site, and make sure to click the <save> button that appears at the bottom of the pages.
Read more;- A complete Guide to Rank your website top in Google: 2020
2. How to Navigate Through the Google Analytics Interface
Once you’ve signed in you will see an overview of the performance of your website. Let’s first start with the Report section which is where you are likely to spend most of your time. The Report section is composed of five main categories. start with the real-time Report-
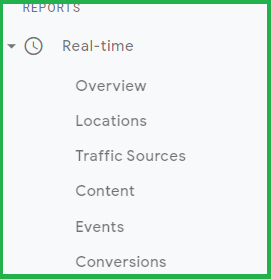
Real-time Report as its name indicates the Real-time Report shows you what’s happening on your site right now. Such as the number of visitors where they are located where they found you on the web what content they are currently visiting etc. By watching real-time Reports you will be able to track all these points.
Audience Report This is where you will find out about your visitor’s demographic and gender, what kind of device they used to reach your site, and these Reports will give you more in-depth insights into your visitors, for example, they Will help you understand your target audience.
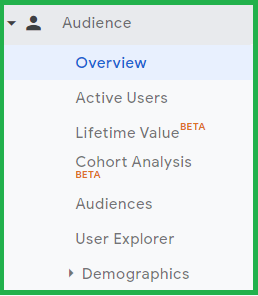
in my case, Max number of people who visit my website are men ,and access my site mostly from the desktop, this is extremely valuable information and helps me to decide how Content will work best with my audience
Read more;- How to use Google Search Console to Optimize site Rank: 2020 Guide
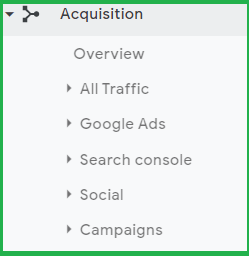
Acquisition Report is probably the preferred Report because this is where you will locate the source of your web traffic. For example, I get most of my traffic from direct, which means that people type the address of my website directly into a browser. The Source / Medium option will give you an accurate breakdown of where your traffic is coming from.
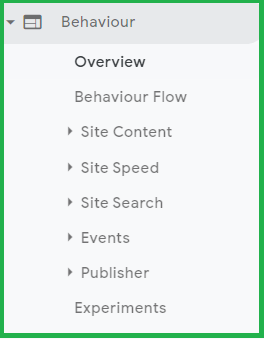
Behavior Report this is where you will learn how visitors behave on your site. Which pages are most visited and how long they stay on your site and very important if people stick around, while they’re visiting a page. This really helps you understand is your content appeals to your audience or not. If your audience is stuck on your content and they trying to appeal to your product that means your content is working well for you.
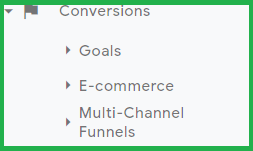
Conversions Report will allow you to track specific actions that your visitors are taking on your website such as filling a form & making a phone call etc. this is very useful as ultimately you want people to not just visit your site but also to get in touch with you.
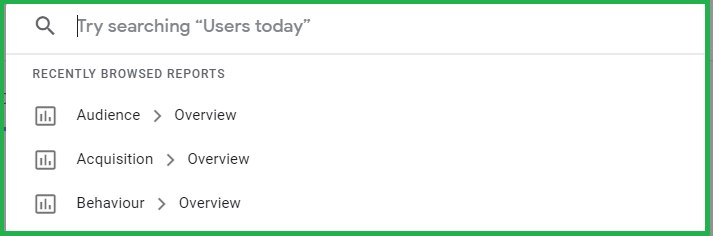
Search Options that help you find helpful documents when you have stuck the entire option that takes you back to the main overview of your site’s performance. Customization options where you can create your Reports and dashboards
A discover Option where you can learn about the latest information of Google Analytics
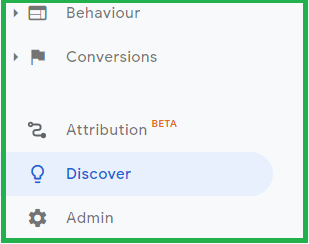
Admin Option where you can modify the settings of your Analytics account.
3. What are the key Metrics you Should Notice
Looking at your visitor’s data you should understand how many people have visited your site and how much time they have spent on each page. Are they left before filling a form/call or any appeal for your product?
How many more visitors you are receiving from the last month or the previous year will give you invaluable insights on your overall website performance to access visitor data.
Go to the > Audience Report and select > Overview
select the date range from the top right corner you wish to apply to get a big enough sample of data you can customize the graph view by hours days week or month. As you can see in the picture mentioned below.
and you can start looking at your data in more details by using the breakdown under the main graph which will include

Users
several users which is the total number of users who have visited your site during your selected period. New users which is the number of visitors who had never visited your site before from the total of users.
In this example out of four thousand seven hundred and seventy-two users (4,772) and four thousand seven hundred and fifty (4,750) of them were new users.
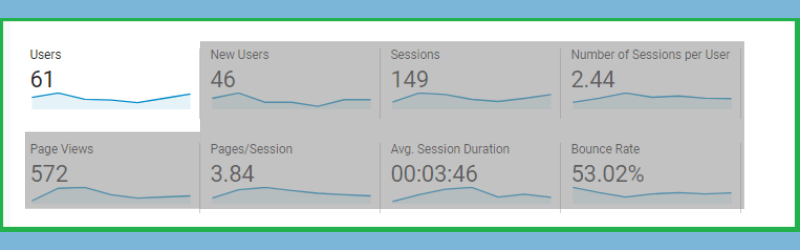
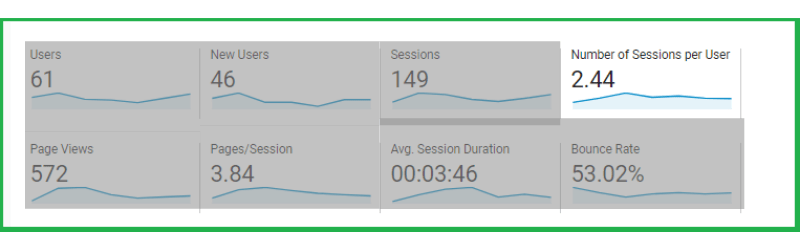
Number of Sessions And Number of Sessions per-users
whenever someone visits your website it will be added as a new session if the visitor leaves or is inactive for 30 minutes the session will expire. If the visitor comes back after 30 minutes a new session will be added to the total session. This means one visitor can create multiple sessions which is the number you will see in the number of sessions per-users.
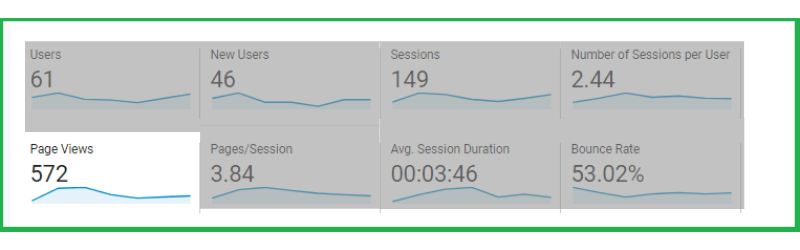
Pageviews
which is self-explanatory your pageviews are the number of pages viewed on your site during the date range you have selected. a pageview is a good indicator of user engagement to your site. The less your pages are viewed by the user, the less user engagement will be with your site.
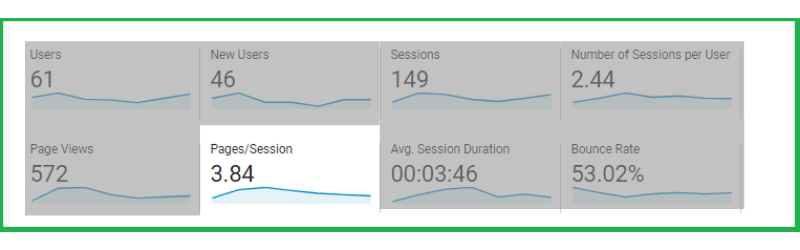
Page/ Session the average number of pages visited for each session more pages per session means that visitors are exploring more of your site.
Average Session duration is the length of time visitors tend to spend on your site. A low number means visitors don’t spend a huge amount of time on your site which means they are not finding it very interesting. This number tends to correlate tightly with the bounce rate.
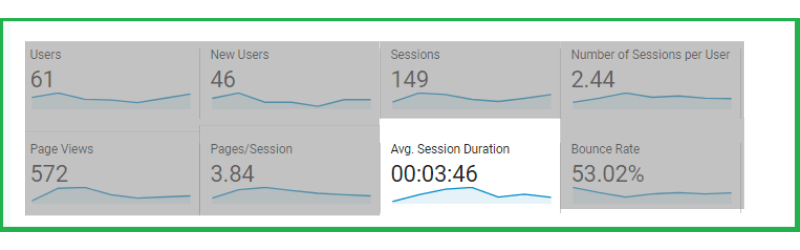
The Bounce Rate is the percentage of people who visited your site but navigated away from the site after only viewing one page. A high bounce rate is generally a sign that your visitors are not finding what they want and that’s why they leave straight away. The higher the bounce rate indicates that your website does not contain enough engagement content. And users are not getting interested in your services or product.

Read more- What is Online Marketing? Importance & Types
Thank You:)